Have you ever wondered if there is a way to automate the most tedious tasks in Google Ads? You’re in luck, here’s the solution for PPC experts
If you want to receive emails automatically when a broken link is found, analyse your daily budget automatically or add those search terms that have converted to your keyword list automatically, I explain it to you in this article.
What are Google Ads scripts?
Google Ads scripts are powerful tools that allow advertisers to automate tasks, streamline campaign management and gain valuable insights into the performance of their ads.
Whether you manage a single campaign or multiple accounts, scripts can save you time and reduce manual errors.
Why Should Beginners Use Google Ads Scripts?
If you’re just starting out with Google Ads, the idea of coding might sound intimidating.
However, scripts are not just for tech experts—they’re designed to make life easier for all advertisers. Here’s why you should consider using them:
- Automation: Simplify repetitive tasks like bid adjustments or keyword performance checks.
- Efficiency: Free up time by letting scripts handle data-heavy tasks.
- Accuracy: Eliminate human error in complex calculations or report generation.

5 Beginner-Friendly and Best Google Ads Scripts
Budget Pacing Script:
- Keeps your campaign budget on track by monitoring daily spend.
- Perfect for ensuring you don’t overspend or underspend your monthly budget.
// Script that tracks monthly budget VS spend month to date.
// It sends email alerts when account has spent over 50% within first 10 days of the month or when account has reached 90% of the spend.
// It tracks emails in sent in google sheet
// It clears the tracking sheet on 1st of the month

var config = {
  budget: 1000, //add in monthly budgets
  emails: "email1@email.com, email2@email.com", //email address for alerts
  emailTracker:
    "https://docs.google.com/spreadsheets/d/1fhL5ITvBzkZrHTz15ywhsLiv_-vr5LpcP4tz9Vz8XnU/edit", //sheet which gets updated with email info -> make a copy
  sheetName: "Email Tracker", //name of the sheet from the email tracker doc
};

function main() {
  var now = Utilities.formatDate(new Date(), "GMT", "yyyy-MM-dd");
  var dateTrunc = new Date();
  var tenDays = new Date();
  dateTrunc.setDate(1);
  tenDays.setDate(10);
  var firstOfTheMonth = Utilities.formatDate(dateTrunc, "GMT", "yyyy-MM-dd");
  var tenthDay = Utilities.formatDate(tenDays, "GMT", "yyyy-MM-dd");
  var account = AdsApp.currentAccount().getName();
  var currency = AdsApp.currentAccount().getCurrencyCode();
  var accountId = AdsApp.currentAccount().getCustomerId();
  var query = `
      SELECT
      campaign.name,
      campaign.id,
      metrics.cost_micros,
      campaign.status
      FROM campaign
      WHERE segments.date BETWEEN '${firstOfTheMonth}' AND '${now}'
      `;
  const report = AdsApp.report(query);
  const rows = report.rows();
  const campaignData = [];
  while (rows.hasNext()) {
    const row = rows.next();
    const campaign = row["campaign.name"];
    const status = row["campaign.status"];
    const campaignId = row["campaign.id"];
    const cost = row["metrics.cost_micros"] / 1000000;
    const campaignObj = {
      campaign: campaign,
      status: status,
      campaignId: campaignId,
      cost: cost,
    };
    campaignData.push(campaignObj);
  }

  //get the total cost MTD
  let costToDate = 0;
  campaignData.forEach(function (campaign) {
    costToDate += campaign.cost;
  });
  var percentOfBudgetSpent = costToDate / config.budget;

  // send emails when spend reaches 50% within first 10 days, when spend reaches 90% of budget and 100% budget. Track emails
  var spread = SpreadsheetApp.openByUrl(config.emailTracker);
  var sheet = spread.getSheetByName(config.sheetName);
  var sheetData = sheet.getDataRange().getValues();
  var email50sent = [];
  var email90sent = [];
  var email100sent = [];
  for (let j = 1; j < sheetData.length; j++) {
    if (sheetData[j][0] && sheetData[j][0] !== "") {
      email50sent.push(sheetData[j][0]);
    }
    if (sheetData[j][1] && sheetData[j][1] !== "") {
      email90sent.push(sheetData[j][1]);
    }
    if (sheetData[j][2] && sheetData[j][2] !== "") {
      email100sent.push(sheetData[j][2]);
    }
  }

  //check if alert has already been sent - if not then send an email
  if (
    now <= tenthDay &&
    percentOfBudgetSpent >= 0.5 &&
    percentOfBudgetSpent < 0.9 &&
    !email50sent.includes(accountId)
  ) {
    const subject = `${account} Budget Alert: Spend over 50% of allocated budget`;
    const emailBody = `Your Account ${account} has spent 50% or more of the allocated budget within the first 10 days of the month <p> Budget: ${currency} ${
      config.budget
    } and Spend Month To date: ${currency} ${costToDate.toFixed(1)}</p>`;
    MailApp.sendEmail({
      to: config.emails,
      subject: subject,
      htmlBody: emailBody,
    });
    var lastRow = email50sent.length;
    sheet.getRange(lastRow + 2, 1).setValue(accountId);
  } else if (
    percentOfBudgetSpent >= 0.9 &&
    percentOfBudgetSpent < 1 &&
    !email90sent.includes(accountId)
  ) {
    const subject = `${account} Budget Alert: You have spent 90% of the allocated budget`;
    const emailBody = `Your account ${account} has spent 90% or more of the allocated budget.<p> Budget: ${currency} ${
      config.budget
    } and Spend Month To date: ${currency} ${costToDate.toFixed(1)}</p>`;
    MailApp.sendEmail({
      to: config.emails,
      subject: subject,
      htmlBody: emailBody,
    });
    var lastRow = email90sent.length;
    sheet.getRange(lastRow + 2, 2).setValue(accountId);
  } else if (percentOfBudgetSpent >= 1 && !email100sent.includes(accountId)) {
    const subject = `${account} Budget Alert: You have spent the allocated budget`;
    const emailBody = `Your account ${account} spend has reached the allocated budget.<p> Budget: ${currency} ${
      config.budget
    } and Spend Month To date: ${currency} ${costToDate.toFixed(1)}</p>`;
    MailApp.sendEmail({
      to: config.emails,
      subject: subject,
      htmlBody: emailBody,
    });
    var lastRow = email100sent.length;
    sheet.getRange(lastRow + 2, 3).setValue(accountId);
  }

  var today = new Date().getDate();
  if (today === 1) {
    //clear the sheet from email data first of the month
    sheet.getRange(2, 1, sheet.getLastRow() + 1, 3).clearContent();
  }
}
Link Checker Script:
- Automatically checks if your ads’ destination URLs are active and working.
- Prevents wasted ad spend on broken links.
Script: https://developers.google.com/google-ads/scripts/docs/solutions/link-checker
Auction Insights Script:
- Helps you analyze how your ads are performing against competitors.
- Provides actionable insights to optimize your bidding strategy.
Script: https://searchengineland.com/auction-insights-3-final-script-287148
Pause Underperforming Ads Script:
- Identifies ads with poor click-through rates or high costs per conversion and pauses them.
- Ensures your budget is allocated to high-performing ads.
const config = {
    CTR_THRESHOLD: YOUR_CTR_THRESHOLD, // Replace YOUR_CTR_THRESHOLD with your desired CTR in decimals (e.g., 0.01 for 1%).
    DATE_RANGE: 'YOUR_DATE_RANGE', // Replace YOUR_DATE_RANGE with your desired date range. Valid pre-defined date ranges are: TODAY, YESTERDAY, LAST_7_DAYS, THIS_WEEK_SUN_TODAY, LAST_WEEK, LAST_14_DAYS, LAST_30_DAYS, LAST_BUSINESS_WEEK, LAST_WEEK_SUN_SAT, THIS_MONTH, LAST_MONTH, ALL_TIME.
    IMPR_THRESHOLD: 100, // Exclude any ads that don't have at least this many impressions
};

function main() {
    const { CTR_THRESHOLD, DATE_RANGE, IMPR_THRESHOLD } = config;
    const adGroupIterator = AdsApp.adGroups().withCondition('Status = ENABLED').get();

    while (adGroupIterator.hasNext()) {
        const adGroup = adGroupIterator.next();
        const adIterator = adGroup.ads().withCondition('Status = ENABLED').get();

        while (adIterator.hasNext()) {
            const ad = adIterator.next();
            const stats = ad.getStatsFor(DATE_RANGE);
            const ctr = stats.getCtr();
            const impr = stats.getImpressions();

            if (ctr < CTR_THRESHOLD && impr > IMPR_THRESHOLD) {
                ad.pause();
                Logger.log(
                    'Paused ad with headline ' +
                        ad.getHeadline() +
                        ' in ad group ' +
                        adGroup.getName() +
                        ' due to low CTR: ' +
                        ctr
                );
            }
        }
    }
}
Quality Score Tracker Script:
- Tracks changes in your Quality Scores over time.
- Helps pinpoint areas to improve your ad relevance and landing page experience.
function main(){
  /*
  * The following preferences can be changed to customize this script.
  * Most of options can be set by using 1 for yes or 0 for no.
  * You don't have to change anything here. The script will do fine with the defaults.
  */
  var config = {
    /*
    * Which of the following charts should be displayed on the dashboard?
    * The "per QS" charts are column charts. They show the current state compared to a previous one (see next option).
    * "Average" and "weighted" charts are line charts, showing changes over time.
    */
    "chartsToDisplay" : {
      "Keywords per QS" : 0,
      "Average QS" : 0,
      "Keywords with Impressions per QS" : 1,
      "Average QS for Keywords with Impressions" : 0,
      "Impressions per QS" : 0,
      "Impression weighted QS" : 1,
      "Clicks per QS" : 0,
      "Click weighted QS" : 0,
      "Conversions per QS" : 0,
      "Conversion weighted QS" : 0,
      "Conversion value per QS" : 0,
      "Conversion value weighted QS" : 0,
    },
    /*
    * Column charts can show a former date for comparison. Set the number of steps you want to go back for this.
    * Note that the date you're comparing this to will depend on how often you've run the script in the past.
    * Example: If the setting is 30 and you ran the script daily, your comparison will be with the values from 30 days before. If you ran it hourly, it will be with values from 30 hours before.
    * If you haven't run the script often enough, the comparison will go as far back as possible.
    * Put 0 to disable the comparison.
    */
    "chartsCompareStepsBack" : 30,
    /*
    * When stats are taken into account (like impressions per QS, or impression weighted QS), this timeframe is used.
    * Note that this affects the values to be tracked and stored. Past values that are already stored won't be affected.
    * Use one of the following: TODAY, YESTERDAY, LAST_7_DAYS, THIS_WEEK_SUN_TODAY, THIS_WEEK_MON_TODAY, LAST_WEEK, LAST_14_DAYS, LAST_30_DAYS, LAST_BUSINESS_WEEK, LAST_WEEK_SUN_SAT, THIS_MONTH
    */
    "statsTimeframe" : "LAST_30_DAYS",
    /*
    * Whether to only look at stats from Google (e.g. for impression weighted QS).
    * Recommended. Quality Score itself only reflects data from Google, so weighting should only take Google into account and leave out search partners.
    * Note that this affects the values to be tracked and stored. Past values that are already stored won't be affected.
    */
    "googleOnly" : 1,
    /*
    * Whether to only track active keywords. This means that the keyword, the adgroup, and the campaign have to be enabled.
    * Recommended. Otherwise inactive keywords with meaningless Quality Scores might skew your data.
    */
    "activeKeywordsOnly" : 1,
    /*
    * Set to 1 if you want your dates (in charts, table headers, and file names) to contain hours and minutes as well.
    * Do this if you want to run the script hourly.
    */
    "useHours" : 0,
    /*
    * Use this option to not keep track of individual keywords' Quality Scores and only save data to the dashboard file.
    * This makes sense if you have more than 400,000 keywords. Note that you don't have to change this: The script will notice on its own and log a message otherwise.
    */
    "skipIndividualKeywords" : 0,
    /*
    * The name of the file where dashboard and summarized data are stored.
    */
    "summaryFileName" : "Dashboard + Summary",
    /*
    * The base folder for all Quality Score Tracker files.
    */
    "baseFolder" : "Quality Score Tracker/",
    /*
    * Whether to add a client folder in the base folder (resulting in a folder like "Quality Score Tracker/CLIENT_NAME (123-456-7890)/")
    * The folder's name is not important, as long as the Adwords client id remains in it.
    * This is useful if you want to track multiple accounts with this script.
    */
    "useClientFolder" : 1,
    /*
    * Select certain campaigns from your account by name.
    * All campaigns that contain this string will be ignored.
    * Leave empty to select all campaigns.
    */
    "campaignName" : "",
  }

  trackQS(config);
}

function trackQS(config){
  var version = "3.0";

  if(config['useHours']) var dateString = Utilities.formatDate(new Date(), AdWordsApp.currentAccount().getTimeZone(), "yyyy-MM-dd HH:mm");
  else var dateString = Utilities.formatDate(new Date(), AdWordsApp.currentAccount().getTimeZone(), "yyyy-MM-dd");

  var folder = getOrCreateFolder(config['baseFolder']);
  if(config['useClientFolder']) folder = getOrCreateClientFolder(folder);

  // Find the latest report file in the folder.
  var maxFileNumber = 0;
  var reportFile;
  var summaryFile;
  var fileIterator = folder.getFiles();
  while(fileIterator.hasNext()){
    var file = fileIterator.next();
    var matches = new RegExp(' #([0-9]+) ').exec(file.getName());
    if(matches && parseInt(matches[1]) > maxFileNumber){
      maxFileNumber = parseInt(matches[1]);
      reportFile = file;
    }else if(file.getName() == config['summaryFileName']) summaryFile = file;
  }

  // No report file found? Add a new one.
  if(maxFileNumber == 0){
    reportFile = addReportFile(folder, "QS Report #1 (" + dateString + ")");
    maxFileNumber = 1;
  }
  // No summary file found? Add a new one.
  if(!summaryFile) summaryFile = addSummaryFile(folder, config['summaryFileName']);

  Logger.log("All files are stored at");
  Logger.log(folder.getUrl());
  Logger.log("The dashboard is here:");
  Logger.log(summaryFile.getUrl());

  var spreadsheet = SpreadsheetApp.open(reportFile);
  var sheet = spreadsheet.getActiveSheet();
  var lastRowNumber = sheet.getLastRow();
  var sheetLastColumn = sheet.getLastColumn();
  var idColumnValues = sheet.getRange(1, 4, lastRowNumber, 1).getValues();
  var summarySpreadsheet = SpreadsheetApp.open(summaryFile);
  updateInfo(summarySpreadsheet, version);
  var sheetCharts = summarySpreadsheet.getSheetByName("Dashboard");

  summarySpreadsheet.setActiveSheet(sheetCharts);
  summarySpreadsheet.moveActiveSheet(1);

  // Track an event in Google Analytics.
  trackInAnalytics(version);

  // Remember the line number for every keyword.
  var lineNumbers = {};
  for(var i = 1; i < lastRowNumber; i++){
    lineNumbers[idColumnValues[i][0]] = i;
  }

  // qsValues represents the new column that will go right next to the others.
  var qsValues = new Array(lastRowNumber);
  qsValues[0] = [ dateString ];
  // Initialize everything with an empty string.
  var qsValuesLength = qsValues.length;
  for(var i = 1; i < qsValuesLength; i++) qsValues[i] = [""];

  // In case new keywords are found, they'll be added as new rows below the rest (campaign, adgroup, keyword, id string).
  var newRows = [];

  // All aggregated data goes in this variable.
  var qsStats = {
    "Keywords" : {},
    "Keywords with impressions" : {},
    "Impressions" : {},
    "Clicks" : {},
    "Conversions" : {},
    "Conversion value" : {}
  };
  // Initialize the arrays so that everything can be added up later. Index 0 is for totals, 1-10 for Quality Scores.
  for(var key in qsStats){
    for(var i = 0; i <= 10; i++){
      qsStats[key][i] = 0;
    }
  }

  // Get the data from AdWords.
  var awql = "SELECT Id, Criteria, KeywordMatchType, CampaignId, CampaignName, AdGroupId, AdGroupName, QualityScore, Impressions, Clicks, Conversions, ConversionValue FROM KEYWORDS_PERFORMANCE_REPORT WHERE Id NOT_IN [3000000, 3000006] AND Status = 'ENABLED' AND AdGroupStatus = 'ENABLED' AND CampaignStatus = 'ENABLED'";
  if(config['googleOnly']) awql += " AND AdNetworkType2 = 'SEARCH'";
  if(config['activeKeywordsOnly']) awql += " AND CampaignStatus = 'ENABLED' AND AdGroupStatus = 'ENABLED' AND Status = 'ENABLED'";
  if(config['campaignName'] != "") awql += " AND CampaignName DOES_NOT_CONTAIN '" + config['campaignName'] + "'";
  awql += " DURING " + config['statsTimeframe'];
  var report = AdWordsApp.report(awql);
  var reportRows = report.rows();

  // Go through the report and count Quality Scores.
  while(reportRows.hasNext()){
    var row = reportRows.next();
    // Save the aggregated data.
    qsStats['Keywords'][row['QualityScore']]++;
    if(row['Impressions'] > 0) qsStats['Keywords with impressions'][row['QualityScore']]++;
    qsStats['Impressions'][row['QualityScore']] += parseInt(row['Impressions']);
    qsStats['Clicks'][row['QualityScore']] += parseInt(row['Clicks']);
    qsStats['Conversions'][row['QualityScore']] += parseInt(row['Conversions']);
    qsStats['Conversion value'][row['QualityScore']] += parseInt(row['ConversionValue']);

    // Save the individual keyword's Quality Score.
    if(!config['skipIndividualKeywords']){
      var id = row['CampaignId']+"_"+row['AdGroupId']+"_"+row['Id'];
      // Check if there is already a line for this keyword
      if(lineNumbers[id]) var line_number = lineNumbers[id];
      else{
        // There is no line for this keyword yet. Create a new one and add the line headers.
        line_number = qsValues.length;
        if(row['KeywordMatchType'] == "Exact") var keyword = '[' + row['Criteria'] + ']';
        else if(row['KeywordMatchType'] == "Phrase") var keyword = '"' + row['Criteria'] + '"';
        else var keyword = row['Criteria'];

        newRows.push([row['CampaignName'], row['AdGroupName'], keyword, id]);
      }

      qsValues[line_number] = [row['QualityScore']];
    }
  }

  // Check if everything fits.
  if(!config['skipIndividualKeywords']){
    // A spreadsheet can hold up to 2 million cells. Calculate if the new data will fit in with the rest.
    // With four rows needed for every keyword, plus one for every tracking run, this won't fit if there are more than 400,000 rows (header + 399,999 keywords).
    if(qsValues.length >= 400000){
      Logger.log("There are too many keywords to be tracked (" + qsValues.length + "). This tool can only track up to 399,999 keywords.");
      Logger.log("A summary will be logged, but individual keyword quality scores cannot be stored.");
      skipIndividualKeywords = true;
    }else if((qsValues.length + 1) * (sheet.getLastColumn() + 1) > 2000000){
      // This spreadsheet is full, a new one is needed.
      // Add new file.
      maxFileNumber++;
      reportFile = addReportFile(folder, "QS Report #" + maxFileNumber + " (" + dateString + ")");
      var newSpreadsheet = SpreadsheetApp.open(reportFile);
      var newSheet = newSpreadsheet.getActiveSheet();
      // Copy the first columns from the old sheet to the new one.
      newSheet.getRange(1, 1, lastRowNumber, 4).setValues(sheet.getRange(1, 1, lastRowNumber, 4).getValues());
      // From now on, work with the new sheet and spreadsheet.
      spreadsheet = newSpreadsheet;
      sheet = newSheet;
      sheetLastColumn = 4;
    }
  }

  // Store the keyword data in the spreadsheet.
  if(!config['skipIndividualKeywords']){
    // If there are new rows, add their line headers beneath the others.
    if(newRows.length > 0){
      sheet.insertRowsAfter(lastRowNumber, newRows.length).getRange(lastRowNumber + 1, 1, newRows.length, 4).setValues(newRows);
      sheet.autoResizeColumn(1).autoResizeColumn(2).autoResizeColumn(3);
    }
    // Add a new column with the tracked data.
    sheet.insertColumnAfter(sheetLastColumn);
    sheet.getRange(1, sheetLastColumn + 1, qsValues.length, 1).setValues(qsValues);
    sheet.autoResizeColumn(sheetLastColumn + 1);

    // Change file name to reflect the new date.
    // Find out which dates are currently noted in the file's name.
    var matches = /\((.*?)( - (.*))?\)/.exec(reportFile.getName());
    if(matches && matches[1]){
      if(matches[2]){
        // There's a start date and an end date.
        var startDate = matches[1];
        var endDate = matches[3];
        if(endDate != dateString){
          var newFileName = reportFile.getName().replace(endDate, dateString);
          reportFile.setName(newFileName);
        }
      }else{
        // There's just a start date.
        var startDate = matches[1];
        if(startDate != dateString){
          var newFileName = reportFile.getName().replace(startDate, startDate + " - " + dateString);
          reportFile.setName(newFileName);
        }
      }
    }else{
      Logger.log("Could not recognize dates in file name " + reportFile.getName() +". File name remains unchanged.");
    }
  }

  // Now take care of the summary file.

  // Get the total numbers.
  for(var key in qsStats){
    for(var i = 1; i <= 10; i++){
      qsStats[key][0] += qsStats[key][i];
    }
  }

  // Prepare a new column for the Percentages data sheet.
  var newValues = [];
  var newValuesNumberFormats = [];

  for(var key in qsStats){
    newValues.push([dateString]);
    newValuesNumberFormats.push(["@STRING@"]);
    for(var i = 1; i <= 10; i++){
      if(qsStats[key][0]) newValues.push([qsStats[key][i] / qsStats[key][0]]); else newValues.push([0]);
      newValuesNumberFormats.push(["0.00%"]);
    }
    newValues.push([qsStats[key][0]]);
    newValuesNumberFormats.push(["0.##"]);
  }

  var sheetPercentages = summarySpreadsheet.getSheetByName("Percentages");
  var sheetAverages = summarySpreadsheet.getSheetByName("Averages");

  var lastCol = sheetPercentages.getLastColumn() + 1;
  var lastRow = sheetAverages.getLastRow() + 1;

  // Add the data to the Percentages sheet.
  sheetPercentages.insertColumnAfter(lastCol - 1);
  sheetPercentages.getRange(1, lastCol, 72, 1).setNumberFormats(newValuesNumberFormats).setValues(newValues);
  sheetPercentages.autoResizeColumn(lastCol);

  // Add a new row with formulas to the Averages sheet.
  sheetAverages.appendRow([""]);
  sheetAverages.getRange(lastRow, 1, 1, 1).setValue(dateString);
  sheetAverages.getRange(lastRow, 2, 1, 6).setFormulasR1C1([[
    "=SUMPRODUCT(Percentages!R2C1:R11C1; Percentages!R2C" + lastCol + ":R11C" + lastCol + ")",
    "=SUMPRODUCT(Percentages!R14C1:R23C1; Percentages!R14C" + lastCol + ":R23C" + lastCol + ")",
    "=SUMPRODUCT(Percentages!R26C1:R35C1; Percentages!R26C" + lastCol + ":R35C" + lastCol + ")",
    "=SUMPRODUCT(Percentages!R38C1:R47C1; Percentages!R38C" + lastCol + ":R47C" + lastCol + ")",
    "=SUMPRODUCT(Percentages!R50C1:R59C1; Percentages!R50C" + lastCol + ":R59C" + lastCol + ")",
    "=SUMPRODUCT(Percentages!R62C1:R71C1; Percentages!R62C" + lastCol + ":R71C" + lastCol + ")"
  ]]);


  // The properties for the charts. This is not meant to be reconfigured.
  var chartsProperties = {
    "Keywords per QS" : {
      "type" : "column",
      "vCol" : 2,
    },
    "Average QS" : {
      "type" : "line",
      "vCol" : 2,
    },
    "Keywords with Impressions per QS" : {
      "type" : "column",
      "vCol" : 3,
    },
    "Average QS for Keywords with Impressions" : {
      "type" : "line",
      "vCol" : 3,
    },
    "Impressions per QS" : {
      "type" : "column",
      "vCol" : 4,
    },
    "Impression weighted QS" : {
      "type" : "line",
      "vCol" : 4,
    },
    "Clicks per QS" : {
      "type" : "column",
      "vCol" : 5,
    },
    "Click weighted QS" : {
      "type" : "line",
      "vCol" : 5,
    },
    "Conversions per QS" : {
      "type" : "column",
      "vCol" : 6,
    },
    "Conversion weighted QS" : {
      "type" : "line",
      "vCol" : 6,
    },
    "Conversion value per QS" : {
      "type" : "column",
      "vCol" : 7,
    },
    "Conversion value weighted QS" : {
      "type" : "line",
      "vCol" : 7,
    },
  };

  var row = 1;
  var col = 1;
  var summarySheets = {
    "dataH": sheetPercentages,
    "dataV": sheetAverages,
    "charts": sheetCharts,
  }

  // Add charts to the dashboard.
  for(var chartName in config['chartsToDisplay']){
    // Skip all charts that are not set to be displayed.
    if(!config['chartsToDisplay'][chartName]) continue;

    addChartToDashboard(chartName, chartsProperties[chartName]['type'], summarySheets, row, col, lastRow, lastCol, chartsProperties[chartName]['vCol'], config['chartsCompareStepsBack']);

    // Add the "Average QS" cells.
    sheetCharts.setRowHeight(row, 60).setRowHeight(row + 1, 20).setRowHeight(row + 2, 270);
    sheetCharts.getRange(row, 2).setValue("Average QS").setFontWeight("bold").setFontSize(24).setBorder(true, true, false, true, null, null);
    sheetCharts.getRange(row + 2, 2).setFontWeight("bold").setFontSize(24).setNumberFormat("0.00").setBorder(false, true, false, true, null, null);
    sheetCharts.getRange(row + 1, 2, 2, 1).setFormulasR1C1(
      [
        ["=LOWER(Averages!R1C" + chartsProperties[chartName]['vCol'] + ")"], ["=Averages!R" + lastRow + "C" + chartsProperties[chartName]['vCol']]
      ]).setBorder(false, true, true, true, null, null);
    sheetCharts.autoResizeColumn(2);
    row += 3;
  }
}

/*
* Checks if there is a folder with the given name in the Google Drive root folder. If not, the folder is created.
* The folderName can be in the form of a complete path with subfolders, like "QS Reports/123/whatever".
* Returns the folder.
*/
function getOrCreateFolder(folderName){
  return getOrCreateFolderFromArray(folderName.toString().split("/"), DriveApp.getRootFolder());
}

/*
* Does the actual work for getOrCreateFolder. Recursive function, based on an array of folder names (to handle paths with subfolders).
*/
function getOrCreateFolderFromArray(folderNameArray, currentFolder){
  var folderName = "";
  // Skip empty folders (multiple slashes or a slash at the end).
  do folderName = folderNameArray.shift(); while(folderName == "" && folderNameArray.length > 0);

  if(folderName == "") return currentFolder;

  // See if the folder is already there.
  var folderIterator = currentFolder.getFoldersByName(folderName);
  if(folderIterator.hasNext()){
    var folder = folderIterator.next();
  }else{
    // Create folder.
    Logger.log("Creating folder '" + folderName + "'");
    var folder = currentFolder.createFolder(folderName);
  }

  if(folderNameArray.length > 0) return getOrCreateFolderFromArray(folderNameArray, folder);
  return folder;
}

/*
* Checks if there is a folder for the current client account in the base folder. If not, the folder is created.
* Existing client folders are recognized by the client id in parentheses. This way, folders can be found again, even if an account has been renamed.
*/
function getOrCreateClientFolder(baseFolder){
  var folderIterator = baseFolder.getFolders();
  var regExp = new RegExp(AdWordsApp.currentAccount().getCustomerId());
  while(folderIterator.hasNext()){
    var folder = folderIterator.next();
    if(folder.getName().match(regExp)) return folder;
  }
  // Since no folder has been found: Create one.
  var newFolderName = AdWordsApp.currentAccount().getName() + " (" + AdWordsApp.currentAccount().getCustomerId() + ")";
  Logger.log("Creating folder '" + newFolderName + "'");
  return baseFolder.createFolder(newFolderName);
}

/*
* Creates a spreadsheet for QS tracking.
* Adds headers to the spreadsheet.
* Returns the file.
*/
function addReportFile(folder, name){
  var spreadsheet = SpreadsheetApp.create(name, 1, 4);
  var sheet = spreadsheet.getActiveSheet();
  sheet.setName("QS history");
  // Put in the table headings
  sheet.getRange(1, 1, 1, 4).setValues([["Campaign", "AdGroup", "Keyword", "ID string"]]);
  //sheet.getRange(1, 1, 1, 4).setFontWeight("bold");
  sheet.setColumnWidth(4, 1);
  var file = DriveApp.getFileById(spreadsheet.getId());
  folder.addFile(file);
  var parentFolder = file.getParents().next();
  parentFolder.removeFile(file);
  return folder.getFilesByName(name).next();
}

/*
* Creates a spreadsheet for the summary and stores it in the folder.
* Creates sheets for the Percentages and Averages.
* Populates header rows and columns.
*/
function addSummaryFile(folder, name){
  var spreadsheet = SpreadsheetApp.create(name);
  var sheetH = spreadsheet.getActiveSheet();
  sheetH.setName("Percentages");

  // Add the first column for the horizontal data table.
  sheetH.getRange(1, 1, 72, 1).setValues(
    [["All keywords"], [1], [2], [3], [4], [5], [6], [7], [8], [9], [10], ['Total'],
     ["Keywords with impressions"], [1], [2], [3], [4], [5], [6], [7], [8], [9], [10], ['Total'],
     ["Impression weighted"], [1], [2], [3], [4], [5], [6], [7], [8], [9], [10], ['Total'],
     ["Click weighted"], [1], [2], [3], [4], [5], [6], [7], [8], [9], [10], ['Total'],
     ["Conversion weighted"], [1], [2], [3], [4], [5], [6], [7], [8], [9], [10], ['Total'],
     ["Conversion value weighted"], [1], [2], [3], [4], [5], [6], [7], [8], [9], [10], ['Total']
    ]
  );
  sheetH.getRange("A:A").setNumberFormat('@STRING@');
  sheetH.autoResizeColumn(1);

  var sheetV = spreadsheet.insertSheet("Averages");
  // Add the first rows for the vertical data table.
  sheetV.getRange(1, 1, 4, 7).setValues([
    ["Date", "Average", "Average for keywords with impressions", "Impression weighted", "Click weighted", "Conversion weighted", "Value weighted"],
    ["Highest", "", "", "", "", "", ""],
    ["Lowest", "", "", "", "", "", ""],
    ["Average", "", "", "", "", "", ""]
  ]);
  // Add some formulas for maximums, minimums, and averages.
  sheetV.getRange(2, 2, 3, 6).setFormulas([
    ["=MAX(B$5:B)", "=MAX(C$5:C)", "=MAX(D$5:D)", "=MAX(E$5:E)", "=MAX(F$5:F)", "=MAX(G$5:G)"],
    ["=MIN(B$5:B)", "=MIN(C$5:C)", "=MIN(D$5:D)", "=MIN(E$5:E)", "=MIN(F$5:F)", "=MIN(G$5:G)"],
    ["=AVERAGE(B$5:B)", "=AVERAGE(C$5:C)", "=AVERAGE(D$5:D)", "=AVERAGE(E$5:E)", "=AVERAGE(F$5:F)", "=AVERAGE(G$5:G)"]
  ]);
  sheetV.getRange(1, 1, 1, 7).setFontWeight("bold").setNumberFormat('@STRING@');
  sheetV.autoResizeColumn(1);
  sheetV.autoResizeColumn(2);
  sheetV.autoResizeColumn(3);
  sheetV.autoResizeColumn(4);
  sheetV.autoResizeColumn(5);
  sheetV.autoResizeColumn(6);
  sheetV.autoResizeColumn(7);

  // Store the spreadsheet.
  var file = DriveApp.getFileById(spreadsheet.getId());
  folder.addFile(file);
  var parentFolder = file.getParents().next();
  parentFolder.removeFile(file);
  return folder.getFilesByName(name).next();
}

/*
* Replaces the About sheet in the summary spreadsheet with a fresh one from the master sheet. This way, the sheet (including the FAQ) stays up to date.
* Also replaces the Dashboard with a fresh copy (resulting in an empty sheet with the correct conditional formatting).
* If there's a new version, a sheet "New Version Available!" is added.
*/
function updateInfo(summarySpreadsheet, version){
  var templateSpreadsheet = SpreadsheetApp.openByUrl("https://docs.google.com/spreadsheets/d/1qnTYdpBCgHP_5u5eQcXmc5gP0NrOrBK51JnTCTlc0_g/");

  var oldSheet = summarySpreadsheet.getSheetByName("Dashboard");
  if(oldSheet) summarySpreadsheet.deleteSheet(oldSheet);
  templateSpreadsheet.getSheetByName("Dashboard v" + version).copyTo(summarySpreadsheet).setName("Dashboard");

  var oldSheet = summarySpreadsheet.getSheetByName("About + FAQ");
  if(oldSheet) summarySpreadsheet.deleteSheet(oldSheet);
  templateSpreadsheet.getSheetByName("About v" + version).copyTo(summarySpreadsheet).setName("About + FAQ");

  var oldSheet = summarySpreadsheet.getSheetByName("New Version Available!");
  if(oldSheet) summarySpreadsheet.deleteSheet(oldSheet);

  // Check if there is a newer version.
  var versionHistory = templateSpreadsheet.getSheetByName("Version History").getDataRange().getValues();
  if(versionHistory[0][0] != version){
    // There's a new version available (at least one).
    // Look for the row which has the info about the current (old) version.
    var oldVersionRow = 1;
    while(oldVersionRow < versionHistory.length && versionHistory[oldVersionRow][0] != version){
      oldVersionRow++;
    }

    // Copy the entire version history.
    var newVersionSheet = templateSpreadsheet.getSheetByName("Version History").copyTo(summarySpreadsheet).setName("New Version Available!");
    // Remove everything about the old version.
    newVersionSheet.deleteRows(oldVersionRow + 1, versionHistory.length - oldVersionRow);
    // Add new Rows at the beginning.
    newVersionSheet.insertRows(1, 6);
    newVersionSheet.getRange(1, 1, 6, 2).setValues([["Latest version:", versionHistory[0][0]], ["Your version:", version], ["", ""], ["Get the latest version at", "http://www.ppc-epiphany.com/qstracker/latest"], ["", ""], ["Newer Versions", ""]]);
    newVersionSheet.getRange(1, 1, 1, 2).setFontWeight("bold");
    newVersionSheet.getRange(6, 1, 1, 1).setFontWeight("bold");
    newVersionSheet.autoResizeColumn(1);
    newVersionSheet.autoResizeColumn(2);
  }
}

/*
* Inserts a line or column chart into the dashboard sheet.
* The chart is based on data from the Percentages or Averages sheet.
*/
function addChartToDashboard(name, type, sheets, row, col, lastRow, lastCol, vCol, compareStepsBack){
  var chartBuilder = sheets['charts'].newChart();
  chartBuilder
  .setOption('title', name)
  .setOption('width', 800)
  .setOption('height', 349)
  .setOption('colors', ['#fa9d1c','#00507d'])
  .setPosition(row, col, 0, 0);

  switch(type){
    case "column":
      var statsRow = (vCol - 2) * 12 + 1;
      // First range for a column chart is always the same column with QS from 1 to 10.
      var dataRanges = [sheets['dataH'].getRange(1, 1, 11, 1)];
      if(compareStepsBack && lastCol > 2){
        // The column for comparison is either the specified number of columns behind lastCol, or 2 (the first column with data).
        dataRanges.push(sheets['dataH'].getRange(statsRow, Math.max(2, lastCol - compareStepsBack), 11, 1));
      }
      dataRanges.push(sheets['dataH'].getRange(statsRow, lastCol, 11, 1));
      chartBuilder = chartBuilder.asColumnChart();
      break;
    case "line":
      var dataRanges = [sheets['dataV'].getRange(5, 1, lastRow - 2, 1), sheets['dataV'].getRange(5, vCol, lastRow - 2, 1)];
      chartBuilder = chartBuilder.asLineChart();
      chartBuilder.setOption("vAxis.maxValue", 10);
      chartBuilder.setOption("vAxis.ticks", [0,2,4,6,8,10]);
      chartBuilder.setLegendPosition(Charts.Position.NONE);
      break;
  }

  for(var i in dataRanges) chartBuilder.addRange(dataRanges[i]);
  sheets['charts'].insertChart(chartBuilder.build());
}

/*
* Tracks the execution of the script as an event in Google Analytics.
* Sends the version number and a random UUID (basically just a random number, required by Analytics).
* Basically tells that somewhere someone ran the script with a certain version.
* Credit for the idea goes to Russel Savage, who posted his version at http://www.freeadwordsscripts.com/2013/11/track-adwords-script-runs-with-google.html.
*/
function trackInAnalytics(version){
  // Create the random UUID from 30 random hex numbers gets them into the format xxxxxxxx-xxxx-4xxx-yxxx-xxxxxxxxxxxx (with y being 8, 9, a, or b).
  var uuid = "";
  for(var i = 0; i < 30; i++){
    uuid += parseInt(Math.random()*16).toString(16);
  }
  uuid = uuid.substr(0, 8) + "-" + uuid.substr(8, 4) + "-4" + uuid.substr(12, 3) + "-" + parseInt(Math.random() * 4 + 8).toString(16) + uuid.substr(15, 3) + "-" + uuid.substr(18, 12);

  var url = "http://www.google-analytics.com/collect?v=1&t=event&tid=UA-74705456-1&cid=" + uuid + "&ds=adwordsscript&an=qstracker&av="
  + version
  + "&ec=AdWords%20Scripts&ea=Script%20Execution&el=QS%20Tracker%20v" + version;
  UrlFetchApp.fetch(url);
}
How to Start Using Google Ads Scripts
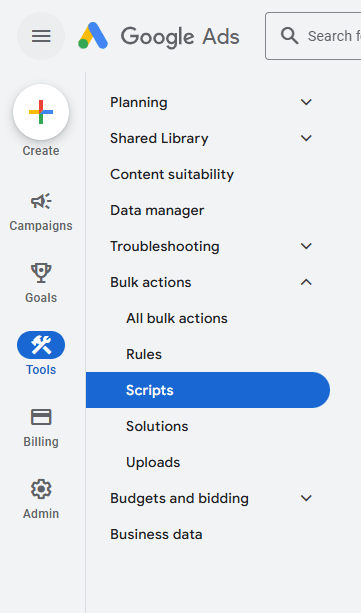
Access Google Ads Scripts:
- Go to your Google Ads account and navigate to Tools & Settings > Bulk Actions > Scripts.
Copy and Paste:
- Most scripts are available online. Simply copy the script, paste it into the editor, and customise it as needed.
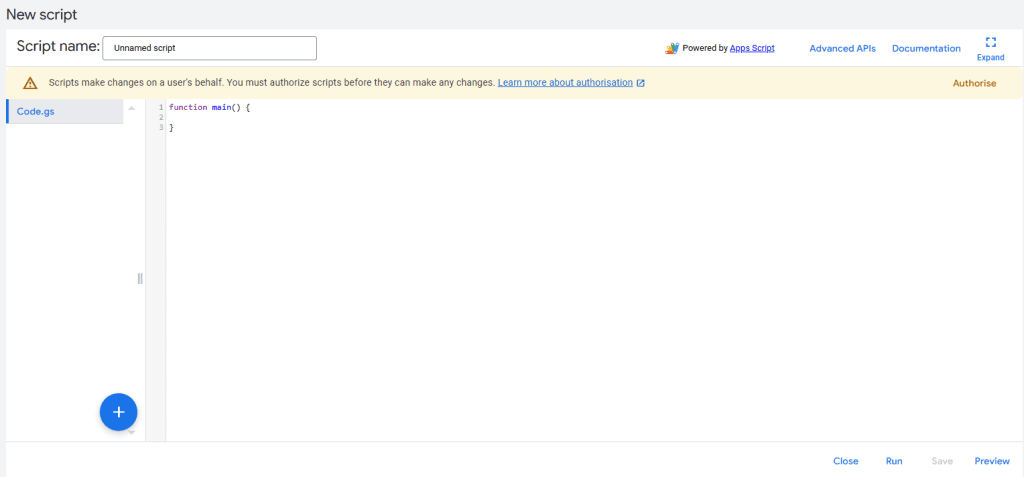
Preview and Execute:
- Always preview the script to ensure it works correctly before applying changes to your campaigns.
Best Practices for Using Scripts
- Start Small: Begin with one or two scripts to familiarise yourself with their functionalities.
- Test First: Always test scripts in a sandbox environment to avoid unintended changes.
- Stay Updated: Google Ads regularly updates its platform, so ensure your scripts are compatible with the latest API changes.
Tools and Resources for Learning Google Ads Scripts
Please find below some links to helpful tools or platforms, such as:
- Google’s official Scripts Guide.
- Reddit always offers great resources and insights.